The Partnership for Assessment of Readiness for College and Careers or PARCC is a collaborative partnership between fifteen states to create and administer state assessments to measure student progress. PARCC assessments are administered for English Language Arts and mathematics for students in grades 3-11, and they’re designed to measure students’ college and career readiness, as well as their progress on standardized Common Core expectations.
At the end of the academic year, most of the parents and students are at a loss to understand the report card. This blog is specially written to help break down the report card into parts and to understand each part
PARCC report cards for both ELA and math assessments come in four parts: Overall Performance, Performance Levels, Score Graph, and Score Breakdown.
Overall Performance

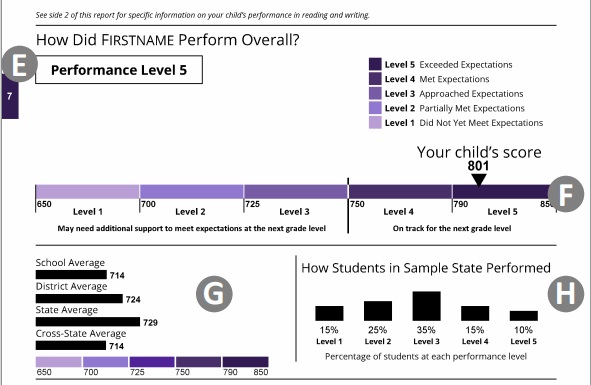
The first thing you’ll see on the PARCC report card is an overall score out of a possible 850 and a performance level 1-5. The overall performance score quickly reveals whether a student is on track with the expectations of his or her grade level and whether or not the student is on track to move on to the next grade level. A scale score is a numerical value that summarizes student performance. All students do not respond to the same set of test items. Hence, each student’s raw score (actual points earned on test items) is adjusted for these differences in difficulty in the various forms and administrations of the test. The resulting scale score helps in a more accurate form of comparison. The performance level demonstrates a student’s current progress with level 1 showing a student’s needing significant improvement and level 5 showing a student at advanced mastery of the knowledge and skills of the current grade level.
In the example shown above, the child has scored 801 out of overall 850
Performance Levels
The next section of the report card goes into more detail about each of the performance levels, and they are color coded. The performance levels are shown as follows:
Level 5 – Exceeded Expectations
Level 4 – Met Expectations
Level 3 – Approached Expectations
Level 2 – Partially Met Expectations
Level 1 – Did Not Yet Meet Expectations
In this case, the child has exceeded expectations level and is on track to the next grade level
Score Graph

Each performance level falls within a score range, which is shown by the colored score graph. Students’ scores are shown on the graph so that students, parents, and teachers can easily see where students fall within the performance level indicators. This section of the test also shows how students are performing in comparison to students in the same school, across the district, across the state, and, depending on the state, across states.
The section H provides a bar graph showing the percentage of students within the state who performed at each of the five performance levels. In this case, the child is among the top 10% of performers in the State.
Score Breakdown
Depending on the test, the score breakdown section will show a student’s overall performance in skills related to English Language Arts or Mathematics.

For ELA
This section shows a student’s overall performance in reading and writing. It also includes a numerical score for a subset of questions under the umbrella of reading and writing. Parents will also be able to see details about their student’s performance on specific ELA skills. This is important for parents to celebrate their child’s strengths as well as see where they can most provide additional support. Also included in this section is a description of the skills needed to meet grade-level expectations.
In the above example, the child needs more help in standards related to informational text and Knowledge and use of conventions,
For Math

The Mathematics section will reveal a student’s performance on specific math skills, so that, again, a parent can celebrate a student’s strengths and provide support where needed. A description of the specific math skills needed to meet grade-level expectations is also included. We can see that in the above example the child has performed well in all areas except modelling and application and needs to practice more in standards related to this.
The PARCC report card gives parents the information they need to help identify where their student needs the most support, as well as revealing where the student’s progress is at their current grade level and whether or not they are on track to move to the next grade level. Parents can use the score for their student to partner with their student’s teacher to come up with ideas to best support their student’s learning.
It’s important to remember that the PARCC report measures a student’s current skills and ability. There’s no need to be discouraged if the performance level isn’t where the student or parent wants it to be just yet. Instead, the PARCC report should be used as a guide to help students learn.
