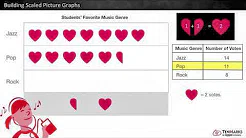
Draw a scaled picture graph and a scaled bar graph to represent a data set with several categories. Solve one- and two-step "how many more" and "how many less" problems using information presented in scaled bar graphs. For example, draw a bar graph in which each square in the bar graph might represent 5 pets.
The apps, sample questions, videos and worksheets listed below will help you learn Graphs.
Coherence Map of 3.MD.B.3
The Coherence Map shows the relationships among the Common Core Standards. The Lumos coherence map not only provides graphical representation and convenient navigation within the standards map but also access to thousands of engaging learning & lesson plan resources such as Practice questions, Videos, Books and Infographics related to every standard. It helps educators and students visually explore the learning standards. It's an effective tool to helps students progress through the learning standards. Teachers can use this tool to develop their own pacing charts and lesson plans.
Standard Description of 3.MD.B.3
Draw a scaled picture graph and a scaled bar graph to represent a data set with several categories. Solve one- and two-step "how many more" and "how many less" problems using information presented in scaled bar graphs. For example, draw a bar graph in which each square in the bar graph might represent 5 pets.


